Veri Yükleme ve Değişkenler
Upload Data and Constructs
Veri Bekleniyor · Awaiting Data
01
Veri Dosyasını Yükleyin
Upload your Excel file
veya · or
▶ Nasıl Kullanılır?
Bilgi Metni Information Notice · TR
- Excel dosyanızın ilk satırında değişkenlerinizi ve maddelerinizi belirtin. Örnek: Tutum (T) → T1, T2, T3. Her madde ayrı sütun olmalıdır.
- Veriniz kısaltmalara göre okunacaktır. Eksik veya yanlış maddeleri manuel olarak (+ Ekle) butonundan ekleyebilirsiniz.
- Verinizi yükledikten sonra, 2. adımda Güvenilirlik ve Geçerlilik Analizlerini göreceksiniz.
Information Notice EN
- Specify your constructs in the first row using: Attitude (AT) → AT1, AT2, AT3.
- Variables will be created automatically from these abbreviations. Missing items can be added manually via (+ Add).
- After upload, Reliability and Validity Analyses will appear in Section 2.
02
Otomatik Değişkenler
Automatically Created Constructs
Yapılar (Constructs)
Henüz veri yok · No data yet
Kontrol Değişkenleri (Control)
Henüz veri yok · No data yet
03
Veri Önizlemesi
First 100 Rows Preview
|
Veri yükleyince burada görünecek · Preview will appear here after upload
|
04
Örneklem Büyüklüğü Hesaplayıcı
Minimum Sample Size Calculator · Hair et al. (2017); Cohen (1992)
33
minimum katılımcı · participants
Cohen/Hair tablosu minimumu: 33
Pratik kural (5 hipotez × 10): 50
Önerilen örneklem: 50 katılımcı
Pratik kural (5 hipotez × 10): 50
Önerilen örneklem: 50 katılımcı
Kaynak · Reference: Hair, J. F., Risher, J. J., Sarstedt, M., & Ringle, C. M. (2019). European Business Review, 31(1), 2–24. |
Cohen, J. (1992). Psychological Bulletin, 112(1), 155–159.
Measurement Model Analysis
Reliability, Validity & Common Method Bias
2.1
Descriptive Statistics
Skewness & Kurtosis · Normality Check
| Item | N | Min | Max | Mean | SD | Skewness | Kurtosis | Normality |
|---|---|---|---|---|---|---|---|---|
| Awaiting analysis | ||||||||
| Construct | N | Min | Max | Mean | SD | Skewness | Kurtosis | Normality |
|---|---|---|---|---|---|---|---|---|
| Awaiting analysis | ||||||||
2.2
Factor Loadings
Outer Loadings · Item Reliability
< 0.50 (Weak)
0.50 – 0.70 (Moderate)
> 0.70 (Strong)
| Construct | Item | Loading | Status | |
|---|---|---|---|---|
| Awaiting analysis | ||||
2.3
Reliability & Convergent Validity
Cronbach α · Composite Reliability · AVE
α > 0.7
CR > 0.7
AVE > 0.5
| Construct | Cronbach α | CR | AVE | |
|---|---|---|---|---|
| Awaiting analysis | ||||
2.4
VIF Values
Variance Inflation Factors · Multicollinearity
≤ 3 (Strong)
3 – 5 (Moderate)
5 – 10 (Weak)
| Construct | Item | VIF | |
|---|---|---|---|
| Awaiting analysis | |||
2.5
Cross Loadings
Discriminant Validity Check
| Item | — |
|---|---|
| Awaiting analysis | |
2.6
Common Method Bias (CMB)
Full Collinearity VIF & Harman's Single Factor Test
References: Podsakoff et al. (2003); Kock (2015).
Construct-level VIF < 3.3 → no CMB issue · Harman single factor < 50% → CMB not dominant
Construct-level VIF < 3.3 → no CMB issue · Harman single factor < 50% → CMB not dominant
Full Collinearity VIF (construct average)
| Construct | Avg VIF | |
|---|---|---|
| Awaiting analysis | ||
Harman's Single Factor Test (< 50% → OK)
Awaiting analysis
Hypotheses & Model
Structural Model Specification
3.1
New Hypothesis
Define a direct effect path
Info
Each hypothesis represents an arrow in your structural model, tested with β, t, and p-values via bootstrapping.
3.2
Model Paths
Hypotheses List
No hypotheses yet
3.3
SEM Model Builder
Auto-Layout Visualization
Constructs are auto-positioned by role (predictor → mediator → outcome). Hypothesis arrows appear automatically as you add them.
Constructs will appear here after data upload
This builder is visualization-only — the analysis uses the hypothesis list above.
3.4
Moderation Effects
Interaction Terms (M × IV → DV)
A moderator changes the strength or direction of the X → Y relationship. The interaction term (M × IV) is automatically added as a hypothesis targeting the DV.
Analysis Results
Structural Model & Discriminant Validity
3.1
Fornell-Larcker
Discriminant Validity · √AVE vs correlations
Diagonal (√AVE) > column correlations → discriminant validity supported.
| Construct | — |
|---|---|
| Awaiting analysis | |
3.2
HTMT Matrix
Heterotrait-Monotrait Ratio · Henseler et al. (2015)
HTMT < 0.85 (strict) or < 0.90 (liberal) → discriminant validity supported.
| Construct | — |
|---|---|
| Awaiting analysis | |
4
Structural Model — Path Coefficients
Direct Effects · Hypothesis Testing
| H | Path | β (Std) | SD | t | p | 95% CI | Decision |
|---|---|---|---|---|---|---|---|
| Hypothesis test results appear here after analysis | |||||||
4.1
Indirect Effects
| Path | β (Std) | SD | t | p | Decision |
|---|---|---|---|---|---|
| Awaiting analysis | |||||
4.2
Total Effects
Total Effect = Direct Effect + Sum of Indirect Effects. If no direct path exists, total = indirect only.
No significance test is reported for the total effect itself, as its bootstrap standard error is not returned by the engine;
the last column reports which components are significant.
| Path | Direct β | Indirect β | Total β | Significant components |
|---|---|---|---|---|
| Awaiting analysis | ||||
5
R² and Q² Values
Explanatory Power & Predictive Relevance
R²: Explained variance of endogenous constructs (Chin 1998: 0.19 weak · 0.33 moderate · 0.67 strong)
Q²: Predictive relevance via blindfolding (> 0 → predictive relevance supported)
Q²: Predictive relevance via blindfolding (> 0 → predictive relevance supported)
| Construct | R² | R² adj | Q² | Interpretation |
|---|---|---|---|---|
| Awaiting analysis | ||||
6
f² Effect Size — Summary
Cohen (1988) thresholds
0.02 (Small)
0.15 (Medium)
0.35 (Large)
| Path | f² | Effect Size |
|---|---|---|
| Awaiting analysis | ||
7
f² Matrix
Effect Size Matrix
| From ↓ / To → | — |
|---|---|
| Awaiting analysis | |
8
Model Fit Indices
SmartPLS methodology · Henseler et al. (2014); Dijkstra & Henseler (2015)
Computed from raw data. Green ● Good | Orange ● Acceptable | Red ● Weak.
Chi-Square is reported as a raw value only: without degrees of freedom it cannot be graded,
so no good/weak verdict is given for it.
| Index | Saturated Model | Estimated Model | Threshold | Status |
|---|---|---|---|---|
| Awaiting analysis | ||||
SRMR: Sun (2005) · d_ULS & d_G: Ringle et al. (2021) ·
χ²/df: Escobedo Portillo et al. (2016) — between 1 and 3 ·
NFI: Escobedo Portillo et al. (2016) — > 0.90 ·
ρ_A: Dijkstra & Henseler (2015) — ≥ 0.70
9
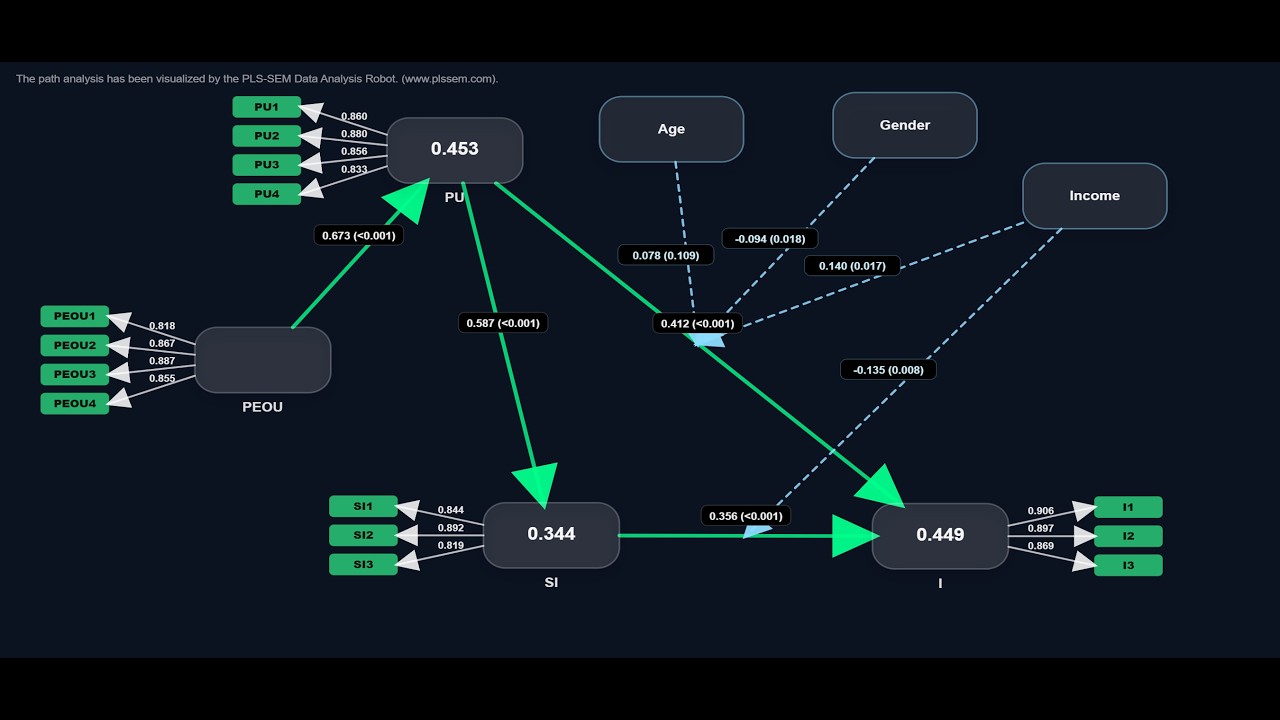
Path Diagram
Structural Model Visualization
Structural path diagram appears here after analysis
AI Interpretation
Contextual insights on your model
Detailed AI-generated interpretation of measurement model, structural model, hypothesis outcomes, R²/Q², effect sizes, and fit indices appears here after analysis.
Confirmatory Factor Analysis (CFA)
Covariance-Based · semopy (lavaan syntax)
What is CFA? Confirmatory Factor Analysis verifies a hypothesized factor structure using covariance analysis. Unlike PLS-SEM (which is variance-based), CFA is covariance-based and typically reports fit indices for the measurement model.
This module uses semopy (Python implementation of lavaan-style syntax). It provides standardized loadings for each item; reliability metrics are computed from the loadings on the frontend.
This module uses semopy (Python implementation of lavaan-style syntax). It provides standardized loadings for each item; reliability metrics are computed from the loadings on the frontend.
CFA.0
Prerequisites & Assumptions
Classical CFA assumptions and sample-size rules of thumb
Upload data and define constructs to see the prerequisites check.
Note: These are rules of thumb, not hard requirements. You may run CFA even if some criteria fail, but interpret fit indices and standard errors with caution.
CFA.1
Model Specification
lavaan-style syntax (reflective)
Model specification appears here after running CFA
CFA.2
Standardized Loadings
Std. estimate + flag for items needing review (< 0.70)
< 0.50 (weak)
0.50 – 0.70 (moderate)
> 0.70 (strong)
| Construct | Item | Std. Loading | Status | Flag |
|---|---|---|---|---|
| Awaiting analysis | ||||
CFA.3
Loadings Matrix
Cross-loading style layout
| Indicator | — |
|---|---|
| Awaiting analysis | |
CFA.4
Reliability & Convergent Validity
Computed from CFA loadings
α > 0.7
CR > 0.7
AVE > 0.5
| Construct | Cronbach α | CR | AVE |
|---|---|---|---|
| Awaiting analysis | |||
CFA.5
Model Fit Indices
Hu & Bentler (1999); Kline (2015)
Fit indices are computed by semopy.calc_stats. Cutoffs:
χ²/df < 3 good, < 5 acceptable ·
CFI & TLI ≥ 0.95 good, ≥ 0.90 acceptable ·
RMSEA ≤ 0.05 good, ≤ 0.08 acceptable ·
SRMR ≤ 0.05 good, ≤ 0.08 acceptable.
χ² chi-square
—
Awaiting analysis
χ² / df < 3 good, < 5 acceptable
—
Awaiting analysis
CFI ≥ 0.90 acceptable
—
Awaiting analysis
TLI ≥ 0.90 acceptable
—
Awaiting analysis
RMSEA ≤ 0.08 acceptable
—
Awaiting analysis
SRMR ≤ 0.08 acceptable
—
Awaiting analysis